Domain coloring
Complex phase portraits
A way to visualize complex functions $f:\mathbb{C}\to\mathbb{C}$ is using phase-portraits. A complex number can be assigned a color according to its argument/phase. Positive numbers are colored red; negative numbers are colored in cyan and numbers with a non-zero imaginary part are colored as in Figure 1, which shows a phase portrait for the function $f(z)=z.$
=z")
In his book Visual Complex Functions, Elias Wegert employs phase portraits with contour lines of phase and modulus (enhanced phase portraits) for the study of the theory of complex functions. See for example Figures 2 and 3 for the function $f(z)=z.$


We say that a complex function $f$ has a root (or a zero) at $z_0,$ if $f(z_0)=0.$ We say that $z_0$ is a pole when $f(z_0)$ is undefined. With the use of enhanced phase portraits, roots and poles of a complex function $f(z)$ can be easily spotted at the points where all colors meet. Figures 4 and 5 show the enhanced phase portrait of the functions $$f(z)=z \quad \text{and}\quad g(z)=1/z,$$ respectively. Observe the contrast between the level curves of modulus in each case.
=z")
=1/z")
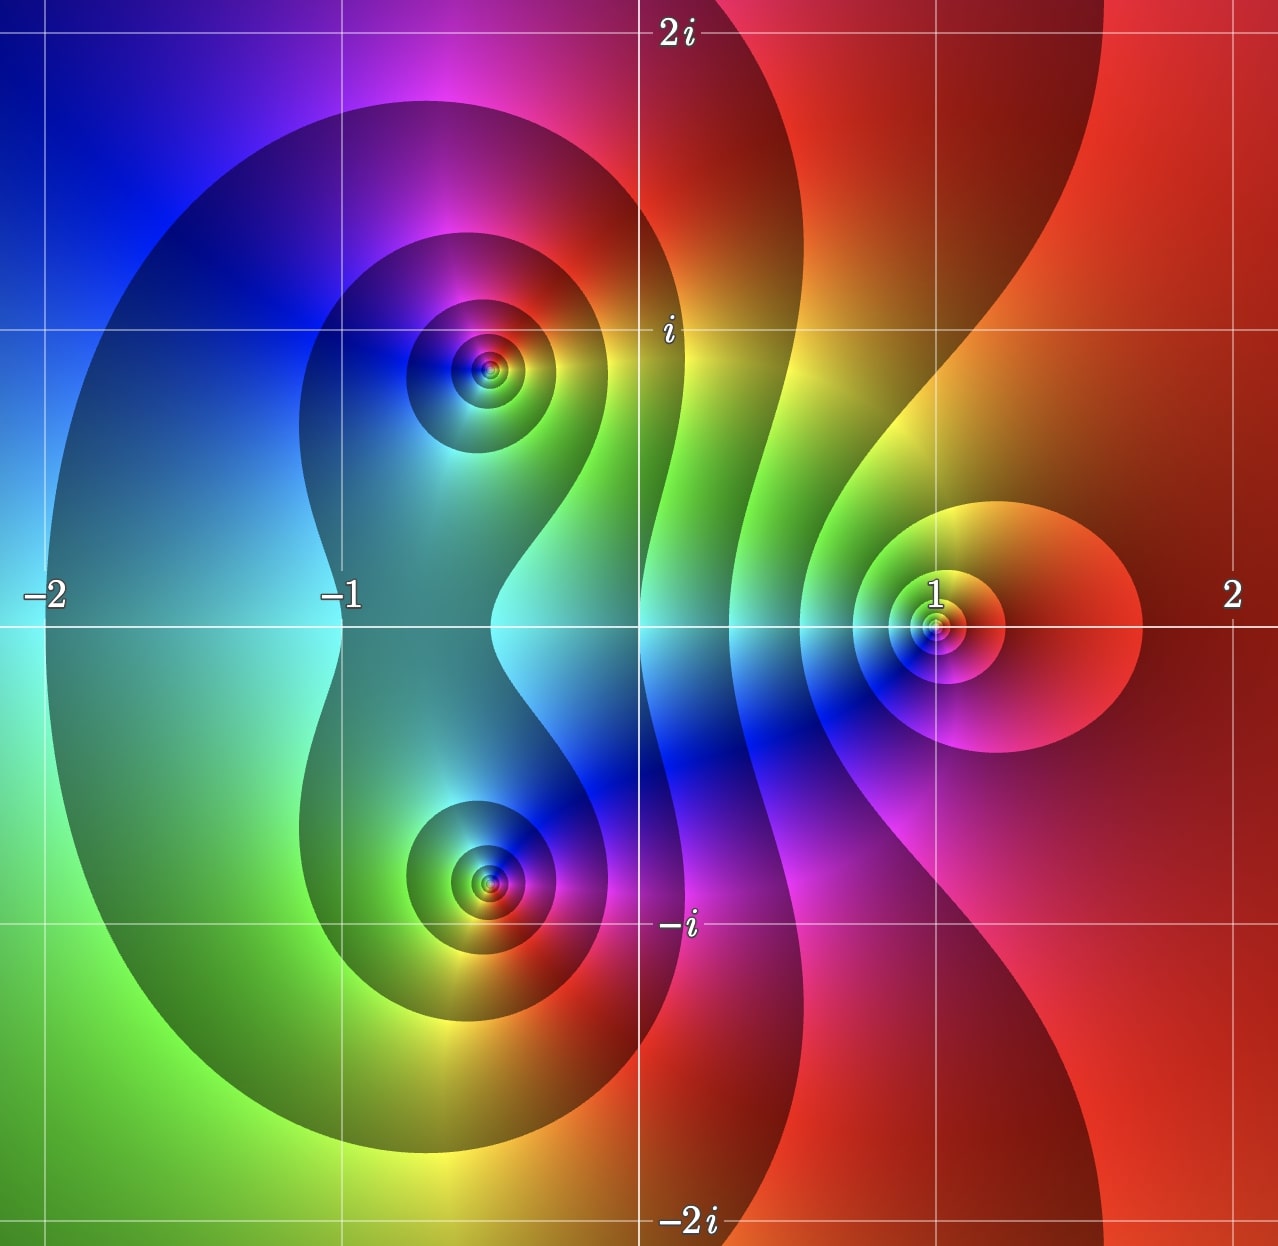
Consider now the function \begin{eqnarray}\label{eq1} f(z)=\frac{z-1}{z^2+z+1} \end{eqnarray} which has a root at $z_0=1$ and two poles at $$z_{1}=\frac{-1 + \sqrt{3}\,i}{2} \quad \text{and} \quad z_{2}=\frac{-1 - \sqrt{3}\,i}{2}.$$
Figure 6 shows the enhanced portrait of (\ref{eq1}) with level curves of the modulus. Notice the behaviour of the level curves of the modulus around the root (right side) and the poles (left side). Can you see the difference?
Explore complex functions
Use the applet below to explore enhanced phase portraits of complex functions.
Warning!
If we do not impose additional restrictions, like continuity or differentiability, the isochromatic sets of complex functions can be arbitrary - but this is not so for analytic functions, which are the objects of prime interest in this text.
In fact, analytic functions are (almost) uniquely determined by their (pure) phase portraits, but this is not so for general functions. For example, the functions $f$ (analytic) and $g$ (not analytic) defined by
Since pure phase portraits do not always display enough information for exploring general complex functions, I recommend the use of their enhanced versions with contour lines of modulus and phase in such cases. Figure 7 shows two such portraits of the functions $f$ (left) and $g$ (right) defined in (\ref{example}).
A notable distinction between the two portraits is the shape of the tiles. In the left picture most of them are almost squares and have right-angled corners. In contrast, many tiles in the portrait of $g$ are prolate and their angles differ significantly from $\pi/2$ - at some points the contour lines of modulus and phase are even mutually tangent.
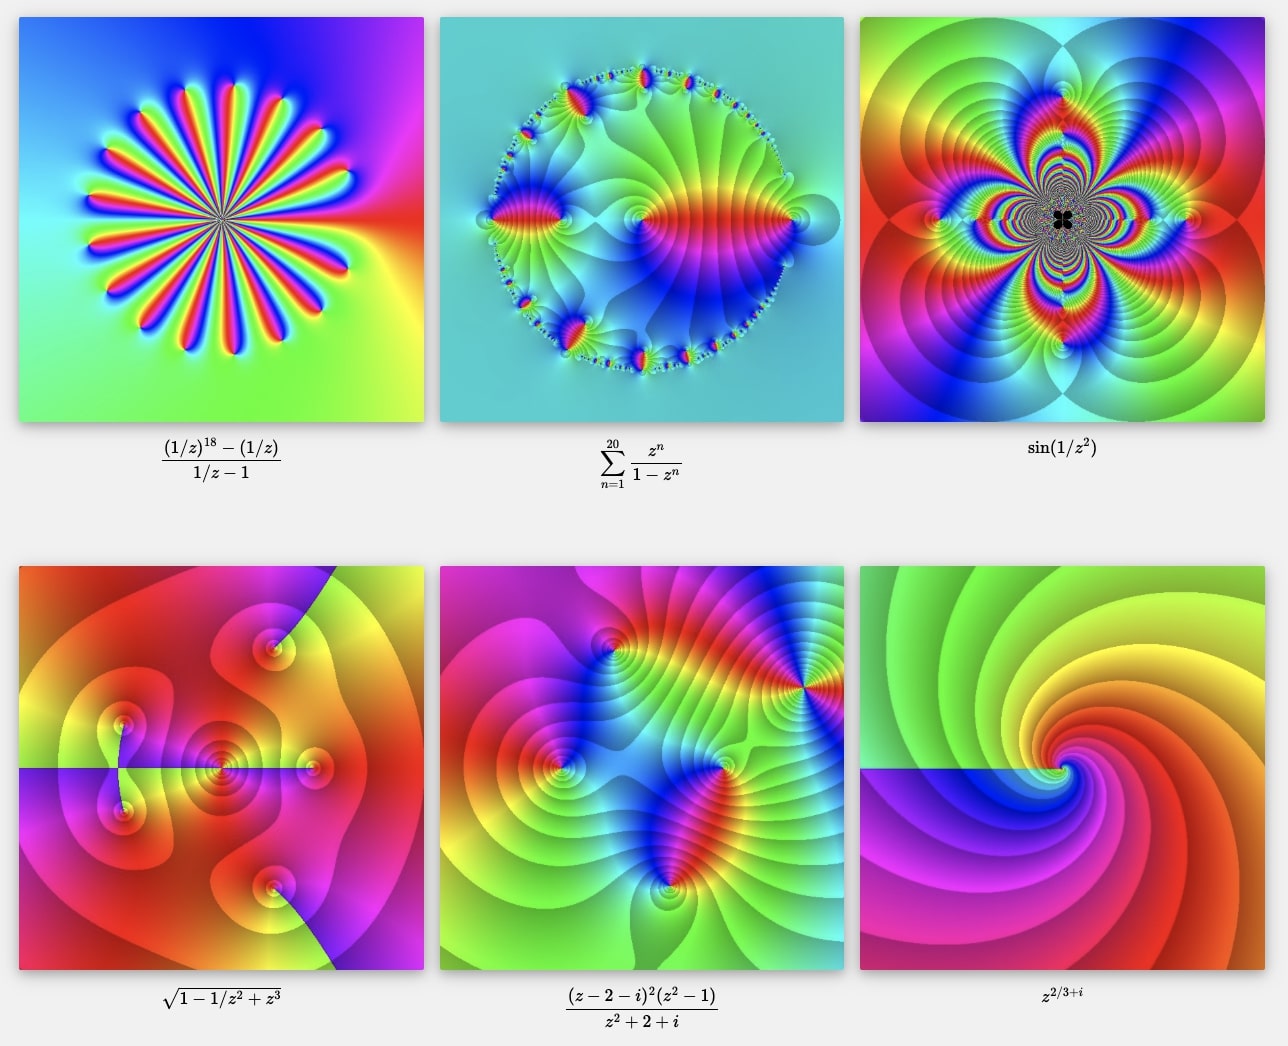
Gallery of functions
If you want to explore more complex functions using domain coloring, then visit the site Domain coloring , where you can also find interactive tools to explore a great variety of complex functions.